Welcome to the Encyclopedia of Saskatchewan. For assistance in exploring this site, please click here.
By: Alan Anderson
Prior to the 1870s, the lands which would become incorporated into the province of Saskatchewan were inhabited sparsely by First Nations, and during the early 19th century by Métis and the fur traders of the North West Company and Hudson’s Bay Company. However, by the mid-1870s the new Dominion of Canada sought both European and American immigrants to supplement the inadequate migration of eastern Canadians as farming settlers out west. Canadian politicians began to view western Canada as ideal for expanding Canadian agriculture, especially Wheat farming. In 1870 the Dominion government purchased Rupert’s Land from the Hudson’s Bay Company, then enacted the Dominion Lands Act in 1872; but although the Act opened this territory to free homesteading, it had a limited effect in attracting settlers. When the Canadian Pacific Railway reached Regina in 1882, homesteaders began to arrive; but it was not until a more aggressive settlement policy was inaugurated in 1896 by Clifford Sifton, Minister of the Interior, that larger numbers of settlers came. Sifton sought to attract immigrants from Central and Eastern Europe as farmers, and opened alternate quarter-sections of railway lands in a first phase, creating a checkerboard settlement pattern. As Ethnic Bloc Settlements rapidly proliferated, there was a concomitant increase in ethnic diversity.
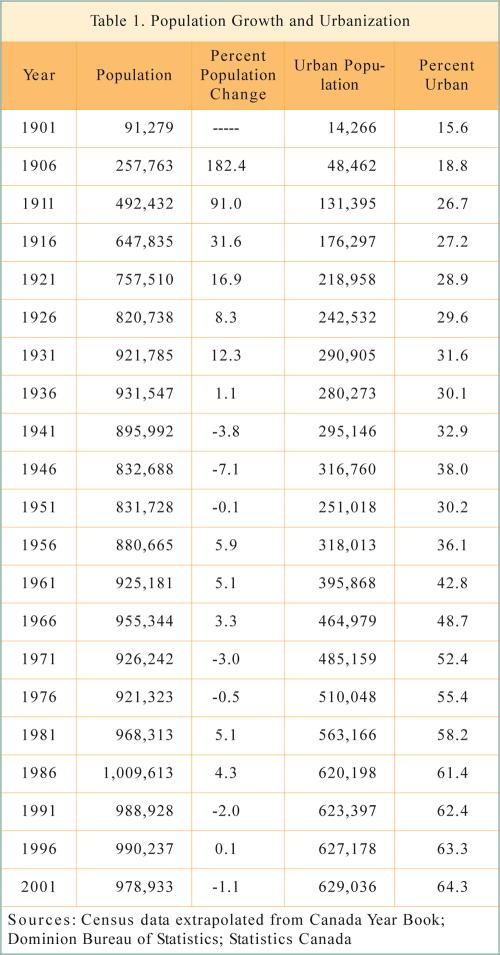
This settlement process was well underway when the province of Saskatchewan was created in 1905. Regina, the “Queen City,” was the focal point of the new province, the seat of the provincial government. Saskatoon, emerging out of the Temperance Colony and destined to be the location of the larger university, had a population of only 4,500 when it officially became a city in 1906. That same year the first census of the new province revealed a population exceeding a quarter of a million, the vast majority (84.4%) being rural. The population continued to increase rapidly through the early 1930s, fed by the largest immigration flow in Canadian history, most of which headed west. World War I only temporarily interrupted this massive flow. By 1931 the Saskatchewan population already numbered close to a million and represented 8.9% of the total Canadian population; in fact Saskatchewan had the third largest population of any province in Canada, after Ontario and Quebec. The population peaked at 931,547 in 1936, then declined during the late 1930s and 1940s to 831,728 in 1951, owing to the Depression and recurrent drought (see Table 1).
The population then began to slowly increase again with the postwar “baby boom,” but did not recover to the 1936 level until the early 1960s. By this time, however, Saskatchewan contained only about 5% of the Canadian population. As shown in the table, fluctuations have characterized overall population trends in Saskatchewan during the past several decades, and the net population gain between 1981 and 2001 came to only 1.1%. With the exception of Newfoundland, Saskatchewan has the slowest growing population of any province in Canada.
Population density in Saskatchewan averages only 1.7 people per square kilometre; among Canadian provinces, only Newfoundland has a lower density. Yet there are great differences between areas: density is as low as 0.1 in northern areas and less than 1.0 in 257 out of 297 rural municipalities, whereas in Saskatoon and Regina it exceeds 3,000 per square kilometre in some residential areas. Rural Saskatchewan has long experienced depopulation and decline, particularly during the Depression and dust storms of the “Dirty Thirties” when some areas—especially semi-arid areas—lost as much as three-quarters of their population and many smaller communities were turned into virtual ghost towns, in contrast to towns which survived as regional service centres.
There has been a marked shift in population from rural to urban (see Table 1), so that by 1970 a majority of Saskatchewan’s population was urban. Today almost two thirds (64.3%, 629,036 in 2001) of Saskatchewan residents live in urban places—mostly Saskatoon and Regina, which together contain 38.3% of the total population, or 375,036 residents within the city limits. The Saskatoon urban region (CMA) has experienced more rapid population growth than the Regina urban region since 1951, and Saskatoon had passed Regina as the largest city in Saskatchewan by the mid-1980s.
Typically, the urban region population tends to increase faster than the city proper: this has been the case in Regina since 1981, in Saskatoon since 1996. Saskatoon proper had a population of 196,811 in 2001, while there were 178,225 residents of Regina: this represented a slight increase of 1.6% in Saskatoon during the past five years, whereas Regina’s population declined by 1.2%. The Saskatoon CMA had a population of 225,927 in 2001, an increase of 3.1% since 1996, whereas the Regina CMA had declined 0.4% to 192,800.
The urbanization of the Aboriginal population (see Aboriginal Population Trends) has contributed to urban growth: in 2001, 36.2% (47,070) of the Aboriginal identity population was on reserve, compared to 46.7% (60,840) in urban places, including 26.8% (34,935) who lived in Saskatoon (where they constituted 9.8% of the city population) and Regina (8.7% of the city population). Yet despite this significant and continuing rural to urban shift, the Aboriginal population still remains less urbanized than the general population. Overall, the urban proportion of population in Saskatchewan is less than in the neighbouring prairie provinces (80.9% in Alberta and 71.9% in Manitoba) or than in Canada as a whole (79.7%).
Population change is measured in terms of natural increase or decrease, based on offsetting fertility and mortality trends, as well as controlling for migration. According to demographic transition theory, if the gap between the birth rate and death rate narrows, the population trend becomes static (the usual case recently for the general Saskatchewan population); whereas if the birth rate remains high while the death rate starts to decline, the gap widens, making for rapid population growth (the case currently for the Aboriginal population). Conversely, if both the birth rate and death rate are high, population growth is limited (the historic case for Aboriginal population). In Saskatchewan the rate of natural increase has fluctuated since the 1940s, and a recent decreasing trend can be noted: for example from 10.3 per 1,000 in 1985 to 3.3 in 2001. Yet overall birth and death rates have remained relatively stable for more than half a century—therefore population growth in this province has been largely dependent upon positive net migration. While the Saskatchewan fertility rate is one of the highest in Canada, the absolute number of births is declining.
The “baby boom” of the 1950s through the early 1960s was followed by the “baby bust” period of reduced fertility, then the “echo boom” during the late 1970s through the early 1980s, when the many former “baby boom” babies had now grown up and were reproducing. The Saskatchewan birth rate peaked at 27.9 per 1,000 in 1947, declined slightly, then was high again during the “baby boom”; it declined markedly to 16.2 in 1973 (perhaps primarily due to increasing cost of living, together with improved, more reliable and accessible contraception), then began increasing again during the “echo boom.” Couples with children are currently declining proportionately in Regina, whereas non-family households, lone-parent families, and couples without children are increasing.
Ethnocultural variations in fertility trends must be noted, however. Some Visible Minorities, usually recent immigrants from high-fertility countries, tend to have higher birth rates. Aboriginals, Mennonites, and Hutterites have exhibited larger average family size, although in all three cases fertility has been declining (among Aboriginals, fertility rates remain far higher on reserves than in cities, which thus reduces the rate of Aboriginal urbanization).
The Saskatchewan death rate, long in the 7.5–8.5/1,000 range, increased to 9.2 in 2001, perhaps to some extent due to the “baby boom” generation of the 1950s now reaching retirement age, but mostly due to a significant expansion of older-aged population. Each year, 62% of deaths occur among people aged 75 and older. During the past several decades, the Aboriginal mortality rate has been steadily decreasing, while still remaining much higher than for non-Aboriginal population for certain causes of death and illnesses.
Population change is not simply a matter of measuring the rate of natural increase/decrease, or fertility and mortality trends: migration serves as a crucial counterpoint to natural increase/decrease. Population growth occurs when in-migration exceeds out-migration. Migration can be international (between other countries and Saskatchewan), inter-provincial (between Saskatchewan and other provinces), or intra-provincial (within Saskatchewan). Saskatchewan had one of the highest immigration rates in Canada during the first two decades of the 20th century. By 1931 immigrants made up more than a third (34.6%) of the province’s population, the rest of which was seldom more than second- or third-generation. But then the immigration flow was greatly affected by the Depression, with low urban employment and recurrent drought making for persistent rural depopulation: Saskatchewan had become an unattractive destination for immigrants. Between 1931 and 1945, the province suffered from the lowest immigration rates to Canada in history. The Canadian immigration rate was increasing again by 1951, but Saskatchewan was no longer a prime destination. Moreover, in recent decades most immigrants into Canada have headed for Toronto, Montreal, and Vancouver—the country’s three largest metropolises. Between 1981 and 2001, Saskatchewan experienced positive net international migration (i.e., more immigrants arriving than emigrants leaving); however, the net gain in population was only 30,985. While 18% of Canadians are foreign-born, only 5% of Saskatchewan residents are. In terms of population growth, it has long been problematic that a substantial proportion of immigrants and refugees eventually leave the province: Saskatchewan now has one of the lowest immigrant retention rates in Canada (57%).
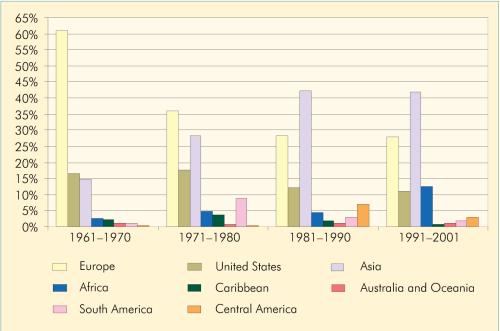
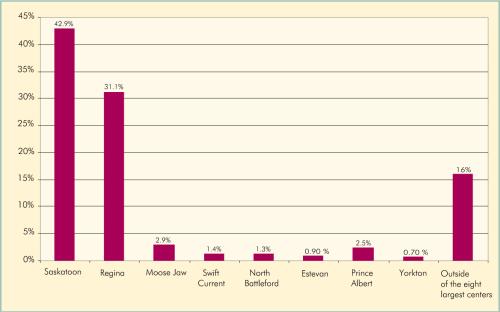
The foreign-born (immigrant) population of Saskatchewan has been aging, yet immigrants have also been arriving: for example, 30% of foreign-born people arrived before 1961, 23.8% during the 1990s. Visible minority populations in Saskatchewan, while increasing, remain minimal. Despite new immigration from Asia, Africa, and Latin America, fully half of the immigrants in Saskatchewan and 87.1% of immigrants who arrived before 1961 are of European origin. Increasing numbers of immigrants and refugees are arriving from Latin America, Tropical Africa, the Middle East, South Asia, East Asia, and Southeast Asia. Currently a third of government-assisted refugees arrive from Sudan and a quarter from Afghanistan; yet in recent years refugees have also come from Europe: Poland, the former Yugoslavia, and the former Soviet Union. Now 42% of immigrants into Saskatchewan have come from Asia, and a majority of them are members of visible minority groups (see Figure 1). Almost three quarters of recent immigrants live in Saskatoon and Regina (see Figure 2). Most recent immigrants are skilled workers, family class, or refugees. Their educational levels are far higher than non-immigrant residents: over a quarter of the adults possess a university degree.
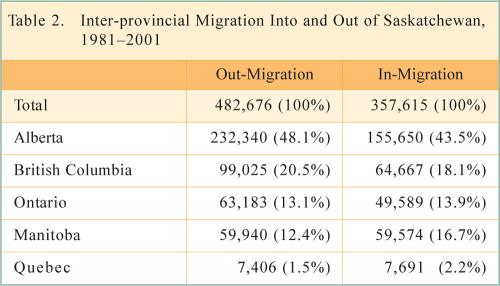
As for inter-provincial migration, Saskatchewan has long had sustained net migration losses, primarily affected by changing economic conditions. The largest annual loss was in 1989–90 (19,928), and the largest over a five-year period in 1987–92 (69,721). The net loss of population over two decades from 1981 to 2001 was 120,000, of which 76,690 was to Alberta, 34,358 to British Columbia, and 13,594 to Ontario. There has been in recent decades a vast movement out of Saskatchewan (see Table 2): between 1981 and 2001, out-migrants totaled 482,676, compared with 357,615 in-migrants. Alberta has been both the major destination (60% of out-migrants) and the major source of inter-provincial migrants (half of all in-migrants).
To some extent, leavers and arrivals could be the same people: someone might go to Alberta to work, then return to Saskatchewan. But this degree of major out-migration has not been equaled in other provinces. The exodus has been influenced by many factors, especially unemployment or limited employment opportunities, farm sales and closures, and leaving to retire in warmer climates. The greatest movement has been between Saskatchewan and its more affluent neighbour, Alberta: so distance can be a factor. Age of migrants is also an important consideration: younger members of the labour force seem most likely to leave; 51.5% of out-migrants in 1981–2001 were aged 15–29. In a sense, the two provincial universities often educate young people to leave. This large number of young adult out-migrants certainly has an effect on the most important reproductive cohorts, again affecting population growth.
The third basic type of migration, intra-provincial, largely assumes the form of urbanization (rural to urban migration), but could also refer to other types of movements including from rural farm to rural non-farm, changing residence within the city (intra-urban), or moving from one city to another (inter-urban). Analyzing these movements can become very complicated: there are distance and temporal factors, as well as socio-cultural factors. For example, while there has recently been substantial migration of non-Aboriginal people out of mining communities in the far north, the Aboriginal population up north has been growing: rural depopulation has to a considerable extent augmented urban populations. There has been continuous out-migration from reserves, especially of young adults, due to a lower standard of living, less health care, limited educational opportunities, unemployment and low income, harsh living conditions, and so on; yet as conditions improve in some reserves, return migrants may be attracted back.
Lower birth rates mean that the main source of population growth has to be migration. But in recent years the capital, Regina, has not been attracting either inter-provincial or intra-provincial migrants as well as other cities in the province: in fact, considering who moved into each city during the past five years (1996–2001), we can note that smaller cities (including Lloydminster, Melfort, Yorkton, Swift Current, North Battleford and Weyburn, but not Estevan) have attracted proportionately more migrants (typically in the 20–30% range) than Saskatoon, Regina, Moose Jaw, or Prince Albert (typically in the 14–18% range).
Saskatchewan had an exceptionally high male disproportion in the sex ratio until the 1940s, ranging between 118.1 in 1901, with a peak of 145.6 in 1906, to 113.2 in 1946. Since then the sex ratio has become more balanced: 109.4 in 1951, and 100.3 in 1986. It must be noted that during the past decade, partially owing to a higher age-specific mortality rate for males, the older the age cohorts, the more females outnumber males. The dependency ratio—the proportion of the total population aged 65 and older (elderly dependency) together with those aged 15 and younger (child dependency)—has been gradually declining since the 1960s: it was 56.8 in 2001. Child dependency has declined from 69.9 in 1901 to 60.0 in 1961, then to 33.2 in 2001, whereas old age dependency has increased from 4.4 in 1901 to 16.3 in 1961, then 23.6 in 2001. Compared with other provinces, Saskatchewan has a high proportion both of elderly and young: 29.2% of the provincial population is under the age of 20, 19% over the age of 60. The provincial age structure has been affected by significant out-migration of young adults as well as by rural decline: many smaller communities have an inverted age structure, with very few children and many middle-aged or elderly adults. There is a “youth bulge” among Aboriginal population, a disproportionate number of people in younger age cohorts; even in urban areas almost half of the Aboriginal population is under 20 years of age. In many Saskatoon and Regina inner-city schools, Aboriginal pupils now form a majority. The Aboriginal dependency ratio (74.9) is far higher than for the general population, and even higher (82.8) on reserve, but lower in Saskatoon and Regina (68.3). The median age on some reserves is under 20, and all northern reserves have child dependency ratios exceeding half the total population there.
The ethno-cultural composition of the Saskatchewan population has changed dramatically over the years. With the settlement process and high immigration between the 1880s and the 1920s, much of the prairie land area was rapidly converted into ethnic bloc settlements. Increasing intermarriage or exogamy over time has led to an increasing proportion of the population claiming multiple rather than single ethnic origins, although recent immigrants have tended to be more endogamous. Visible minorities now constitute 2.9% of the Saskatchewan population (compared to 13.4% nationally). Visible minorities are concentrated in the province’s two largest centres; in 2001, visible minorities made up 5.6% of Saskatoon’s population and 6.3% of Regina’s population. Altogether, 80.8% (20,290) of the province’s visible minority population lives in these two cities. (See also ethnic bloc settlements, Rural Population, urban ethnic diversity, visible minorities, inter-provincial migration, International Immigration, Aboriginal population trends, Urban Aboriginal Population)
Alan Anderson
Print EntryHOME | BROWSE BY SUBJECT | ENTRY LIST (A-Z) | IMAGE INDEX | CONTRIBUTOR INDEX | ABOUT THE ENCYCLOPEDIA | SPONSORS TERMS OF USE | COPYRIGHT © 2006 CANADIAN PLAINS RESEARCH CENTER, UNIVERSITY OF REGINA | POWERED BY MERCURY CMS |
|||
| This web site was produced with financial assistance provided by Western Economic Diversification Canada and the Government of Saskatchewan. |
|||
| Ce site Web a été conçu grâce à l'aide financière de Diversification de l'économie de l'Ouest Canada et le gouvernement de la Saskatchewan. |
|||